Mitral Valve Segmentation from Clinical 4D Ultrasound
Motivation
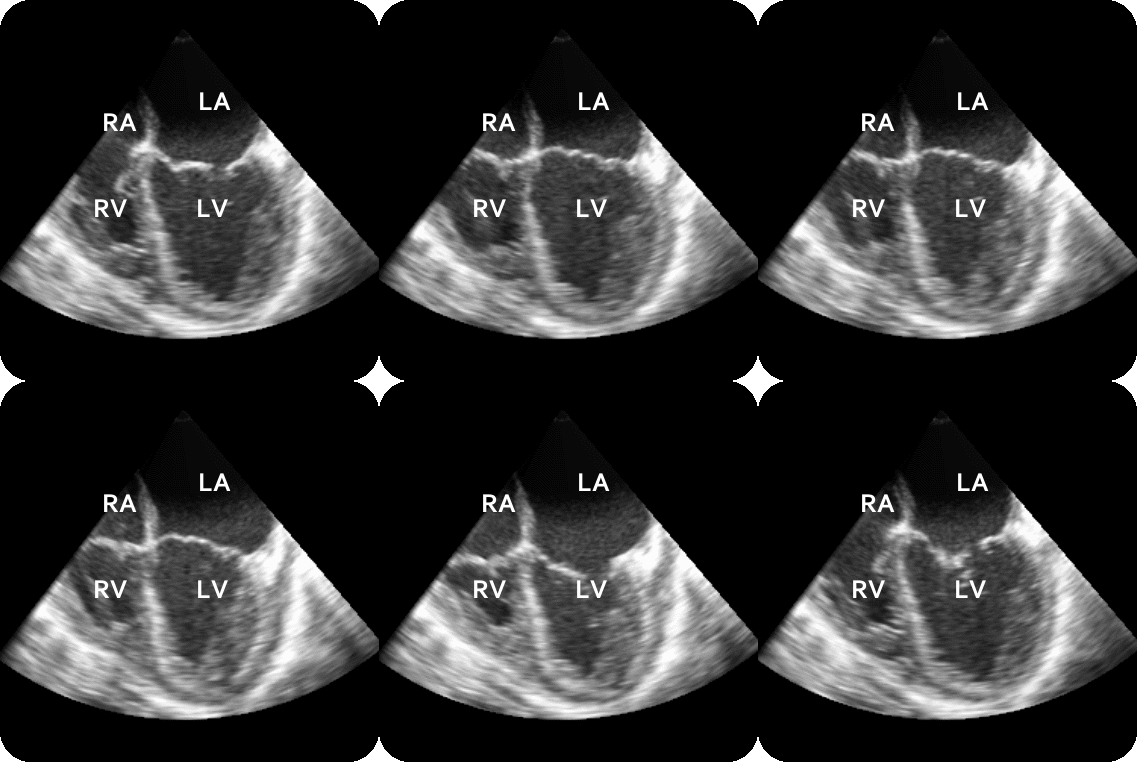
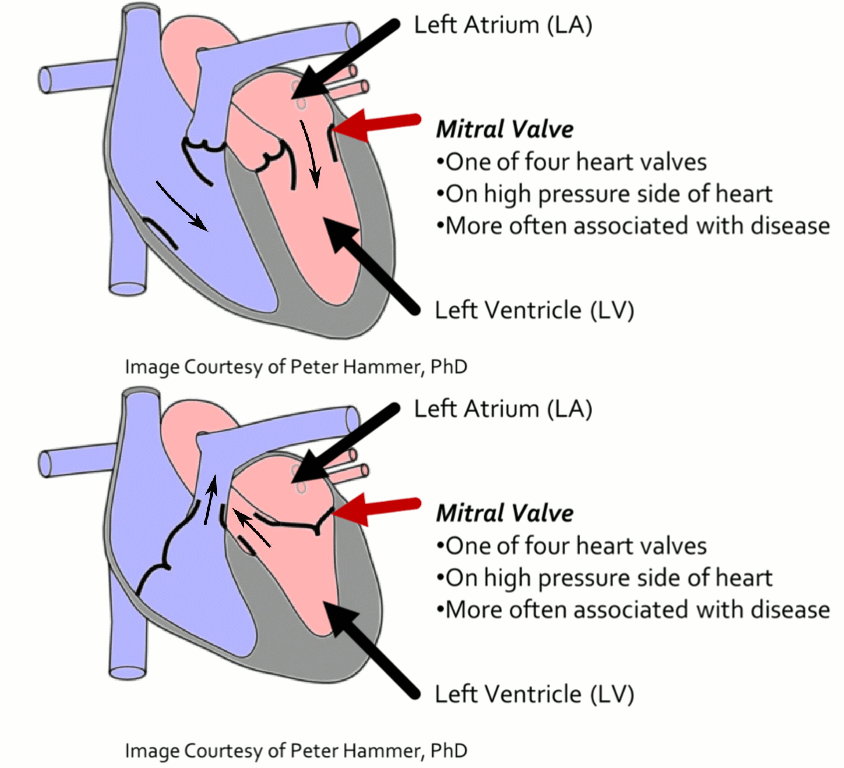
Successful clinical treatment of mitral valve disease is dependent on understanding the complexities of patient-specific valve behavior. Mechanical models of the mitral valve, designed to predict valve closure and generated using patient-specific measurements, have proven to be effective tools for studying valve behavior. To be clinically feasible, these models need to be generated from ultrasound images, which are commonly acquired during the diagnosis and treatment of patients. However, methods of generating accurate models from ultrasound data using minimal user-input and interaction are not available.
 |
 |
Methods
We designed methods for mitral valve segmentation which operate by first segmenting the annulus for a closed valve. This is done using a novel Thin Tissue Detector and graph-cut methods. A valve state predictor and constrained optical flow algorithm is then used to segment the mitral annulus throughout a temporal sequence. The mitral leaflets are then found when the valve is open using a graph-cut based method along with a level set formulation. The leaflets are then tracked throughout a temporal sequence using deformable model techniques along with information about leaflet tissue properties. To accurately track the fast moving valve structures using ultrasound, we also developed methods for reconstructing high temporal resolution ultrasound from standard acquisitions, which included the development of a real-time image-based rigid registration algorithm.
Results
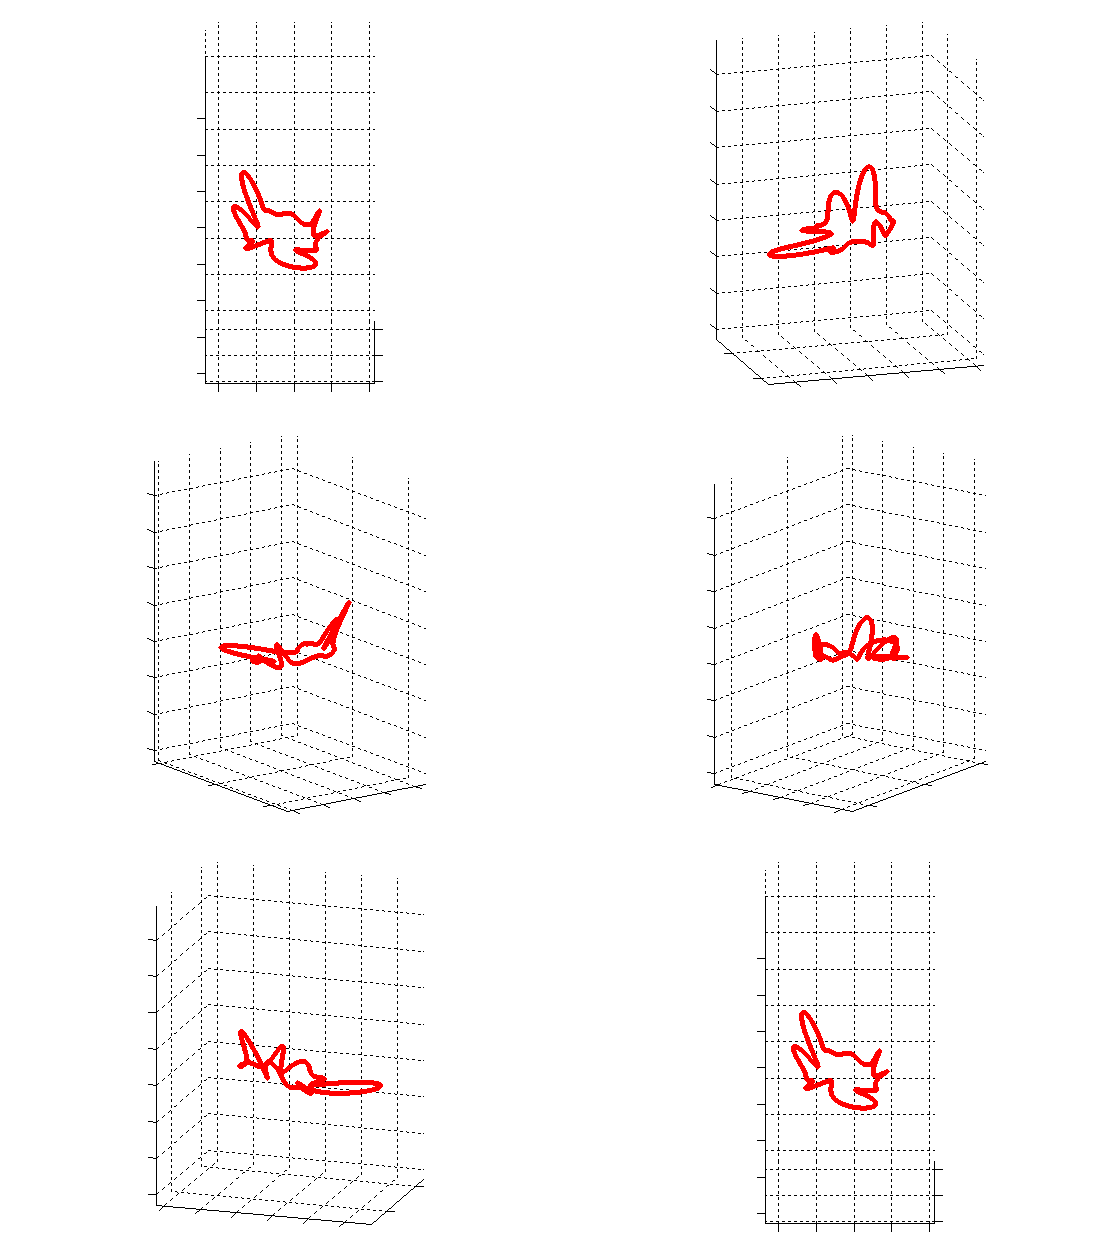
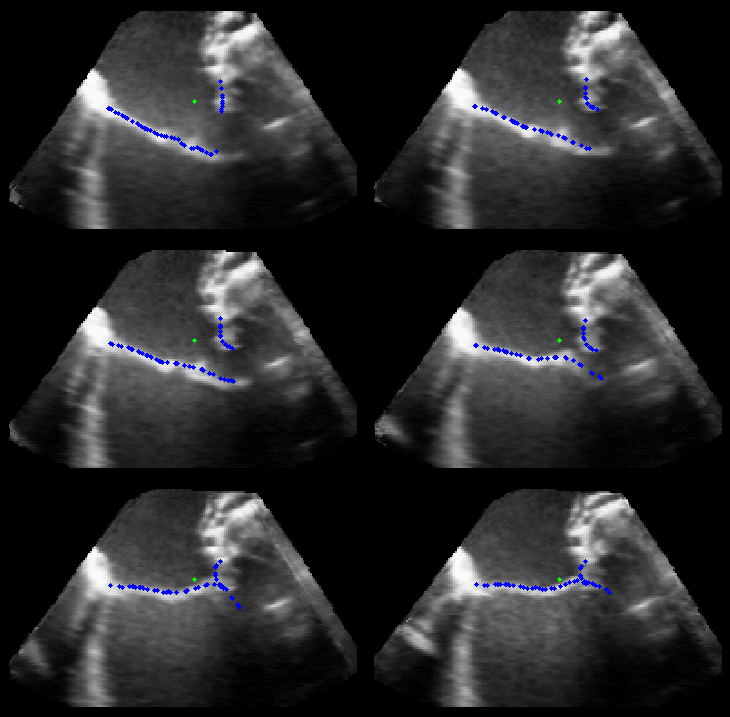
The results from several of the methods are shown in Figures 2-5. Figure 2 shows a comparison of the mitral valve annulus as found in a clinical image compared to the annulus delineated by a group of 10 experts. Figure 3 compares the accuracy and robustness of the constrained optical flow algorithm developed for annulus tracking versus a traditional optical flow algorithm. The detail and accuracy of the automated leaflet segmentation is shown in Figure 4, where the automatically found leaflet mesh is compared to manual leaflet tracings. The segmented mitral valve for a normal and diseased mitral valve are shown in Figure 5. The frames shown are a subset of the longer high temporal resolution sequence.
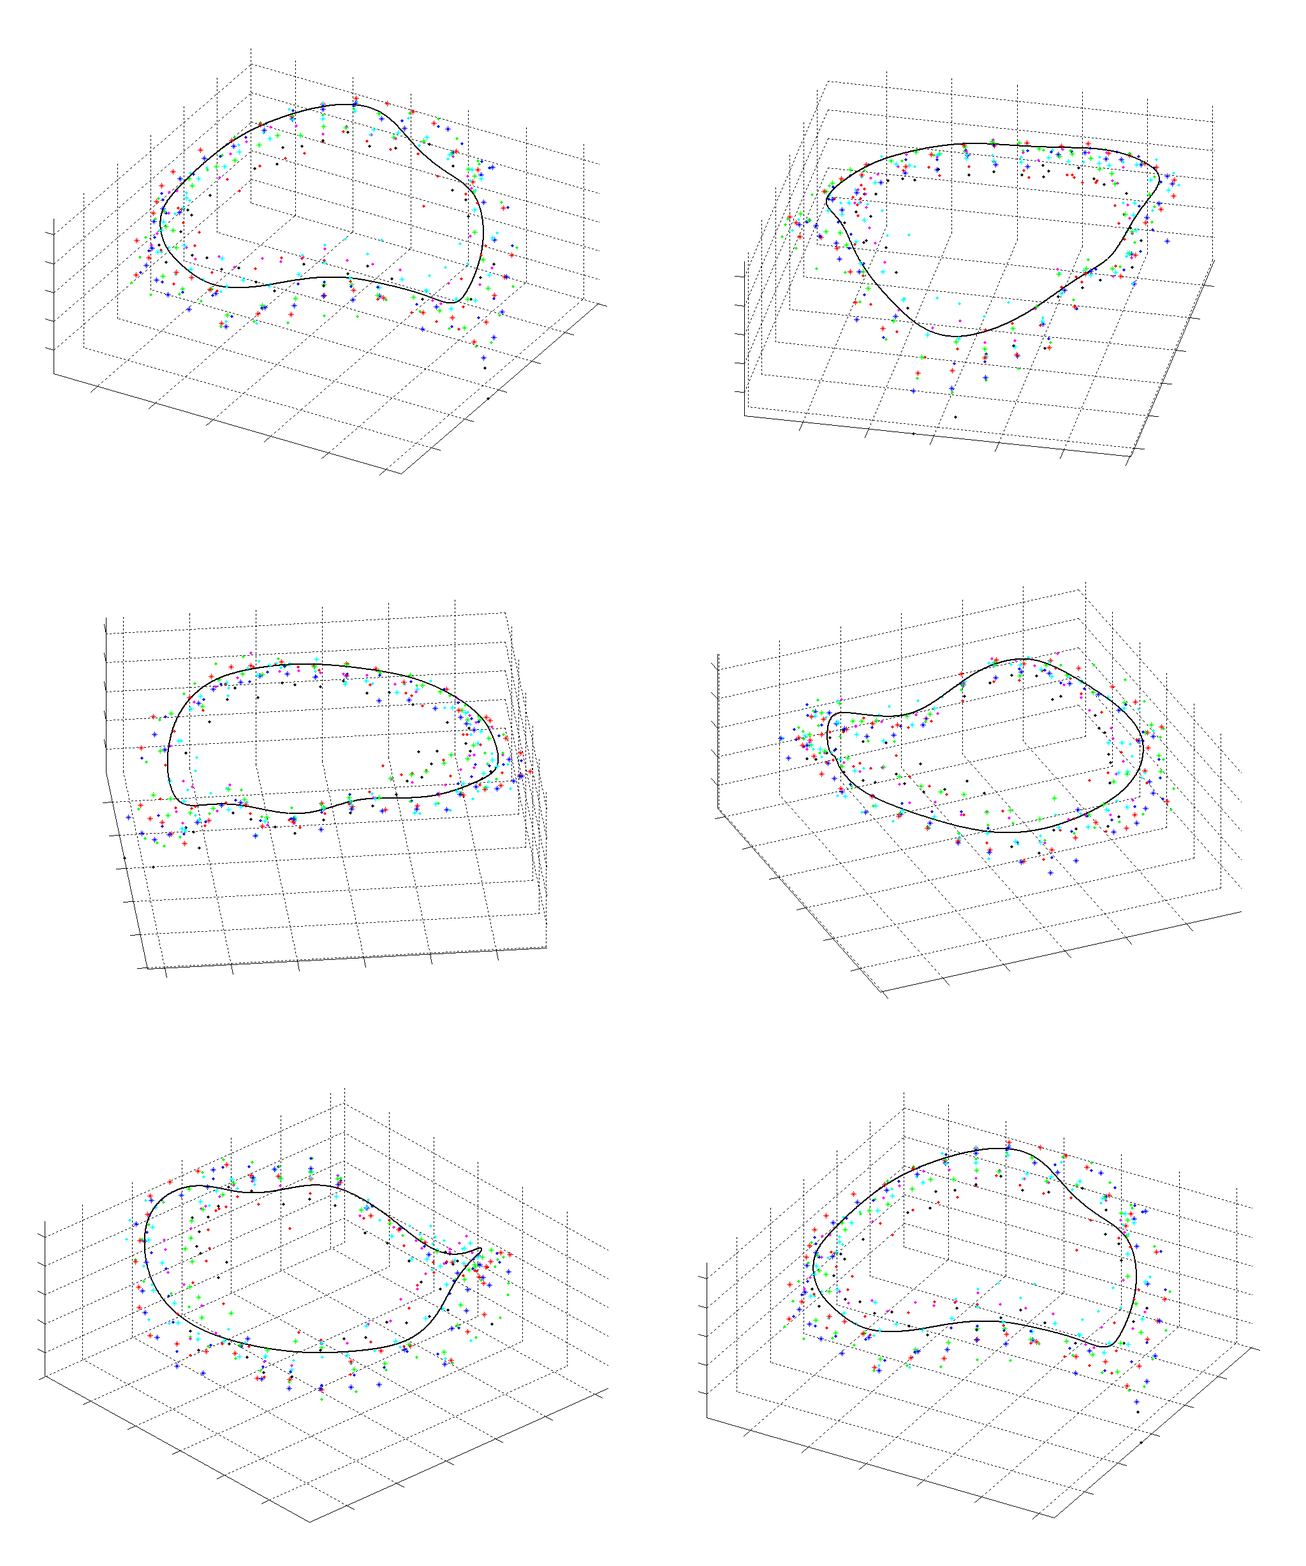 Fig. 2.Typical comparison between the algorithmic annulus (solid line) and points delineated manually by experts on clinical 3DUS images. |
|
| Figure 3 shows an animation of valve closure. The closed surface of the valve predicted by the model was validated by comparing it directly to a mesh produced directly from the image of the valve in the closed position. Error is computed as the magnitude of the distance between corresponding points on the closed mesh predicted by the model and the closed mesh produced directly from imaging. Figure 4 shows a top view of the mesh of the closed valve overlaid with color corresponding to the error. Mean error across the surface is 1.1 mm. |
 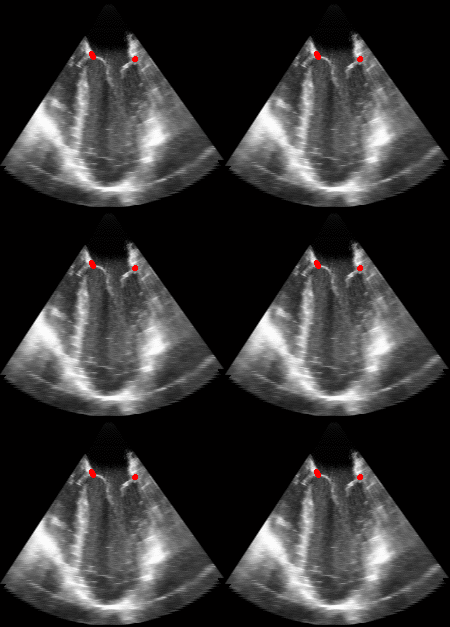

|
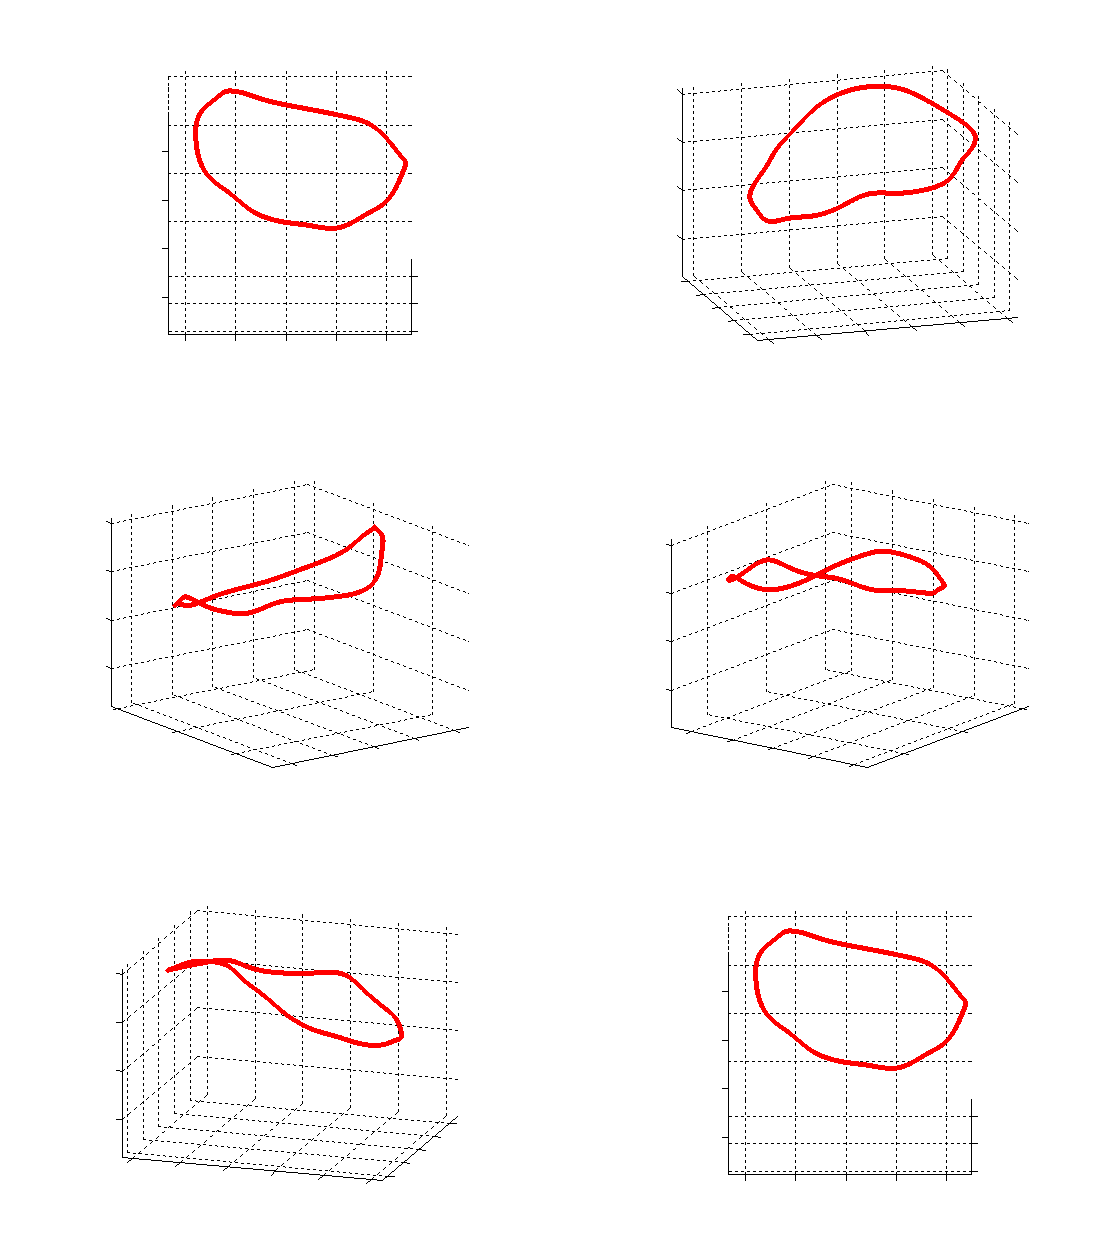 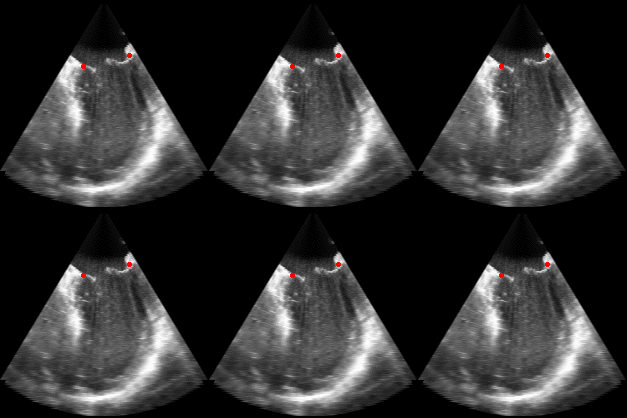
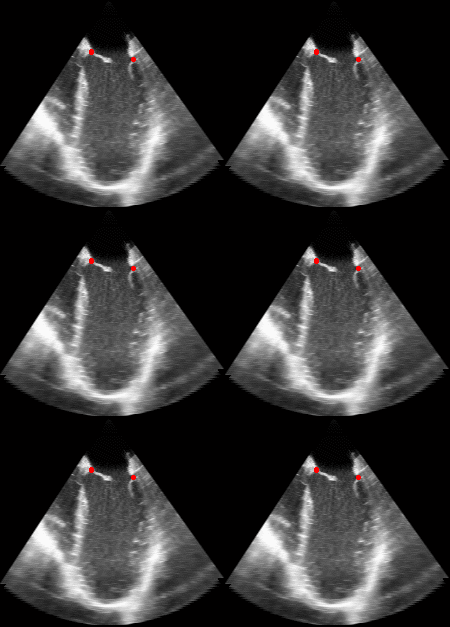
|
Fig. 3.Comparison of the resulting 4D annulus delineation for an example 4DUS sequence shown when tracking is performed using the original Lucas & Kanade [Lucas and Kanade, 1981] optical method (Left) versus the constrained optical flow formulation (Right). |
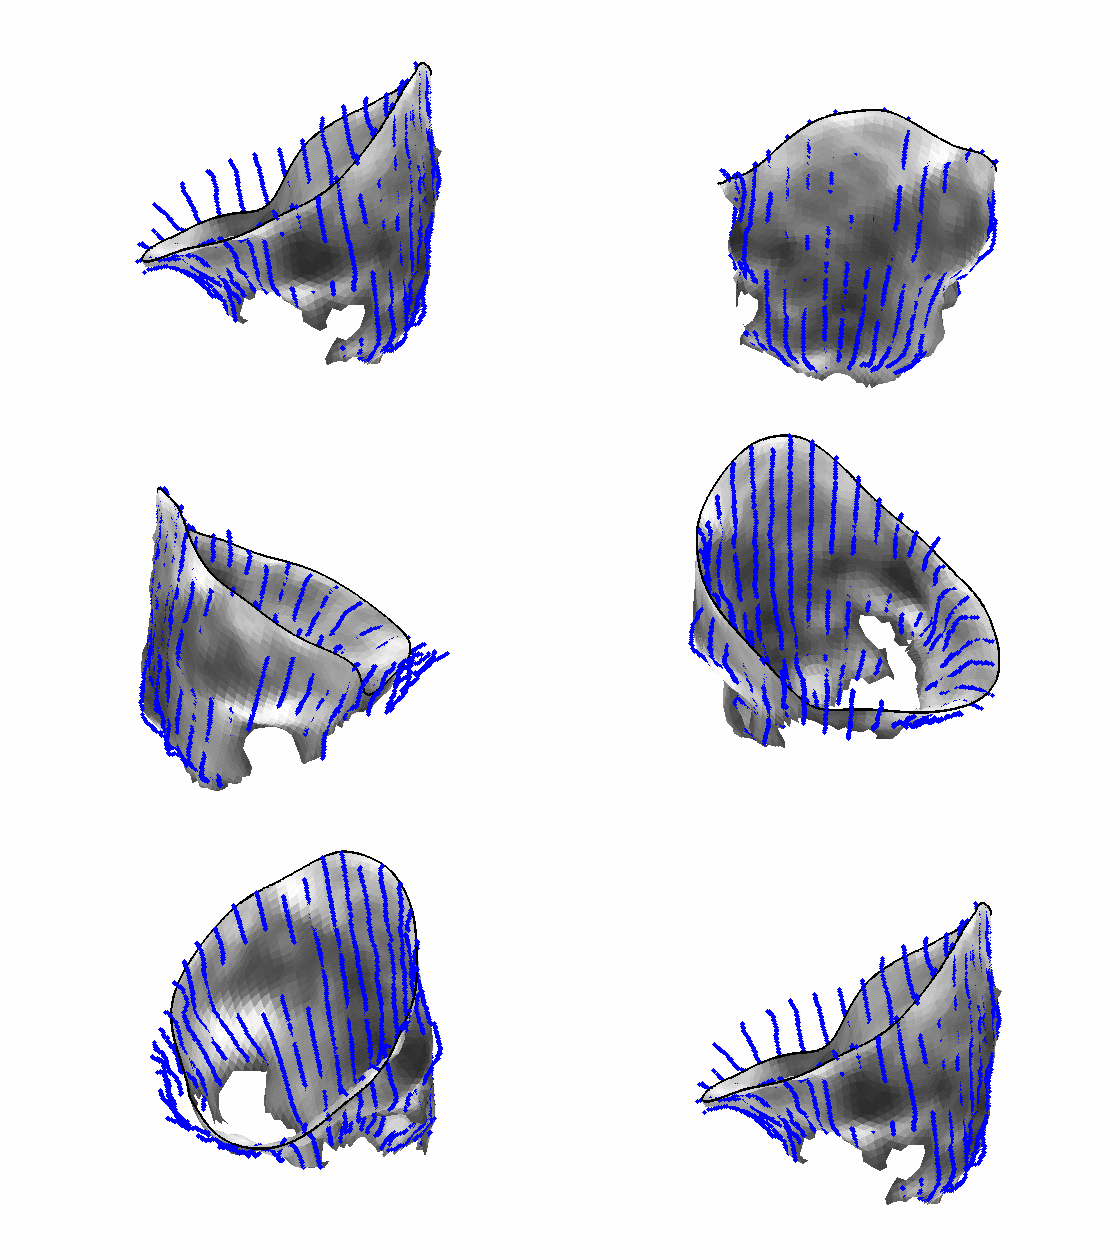 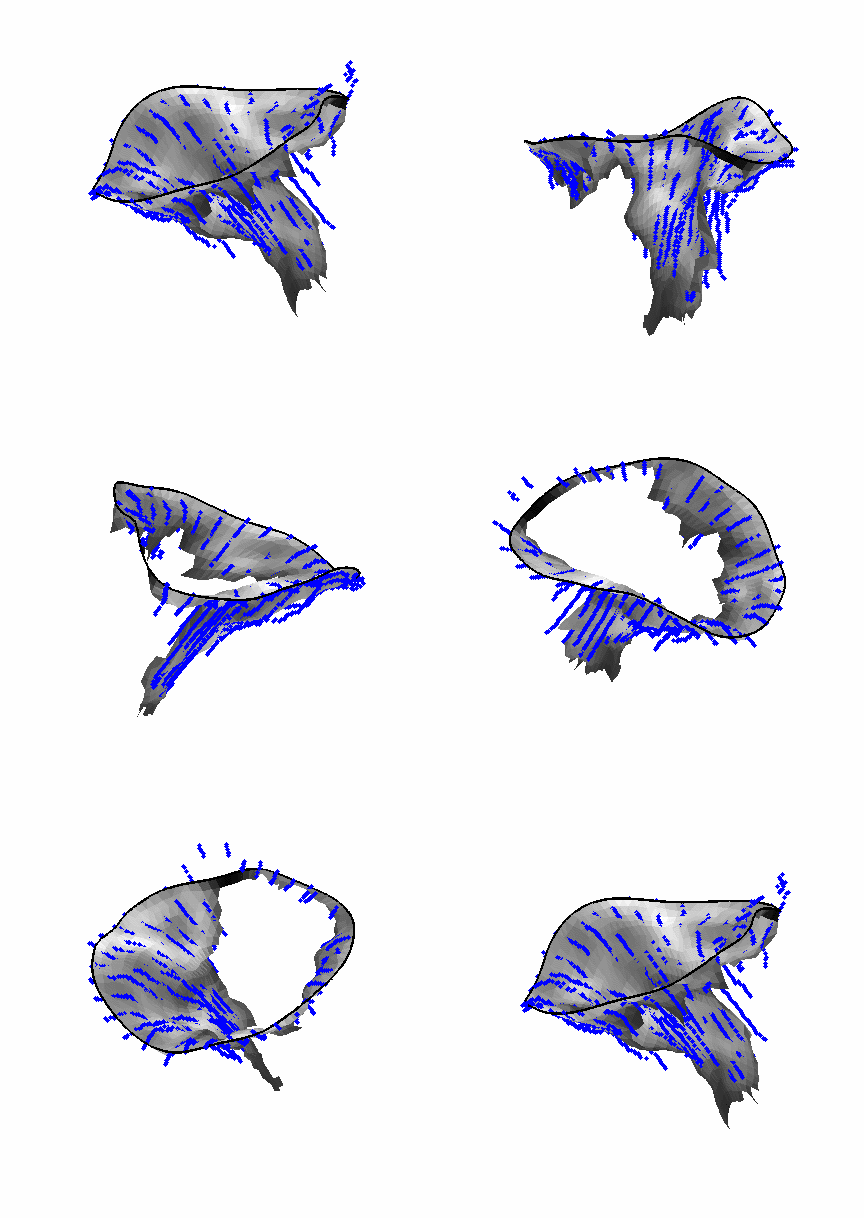 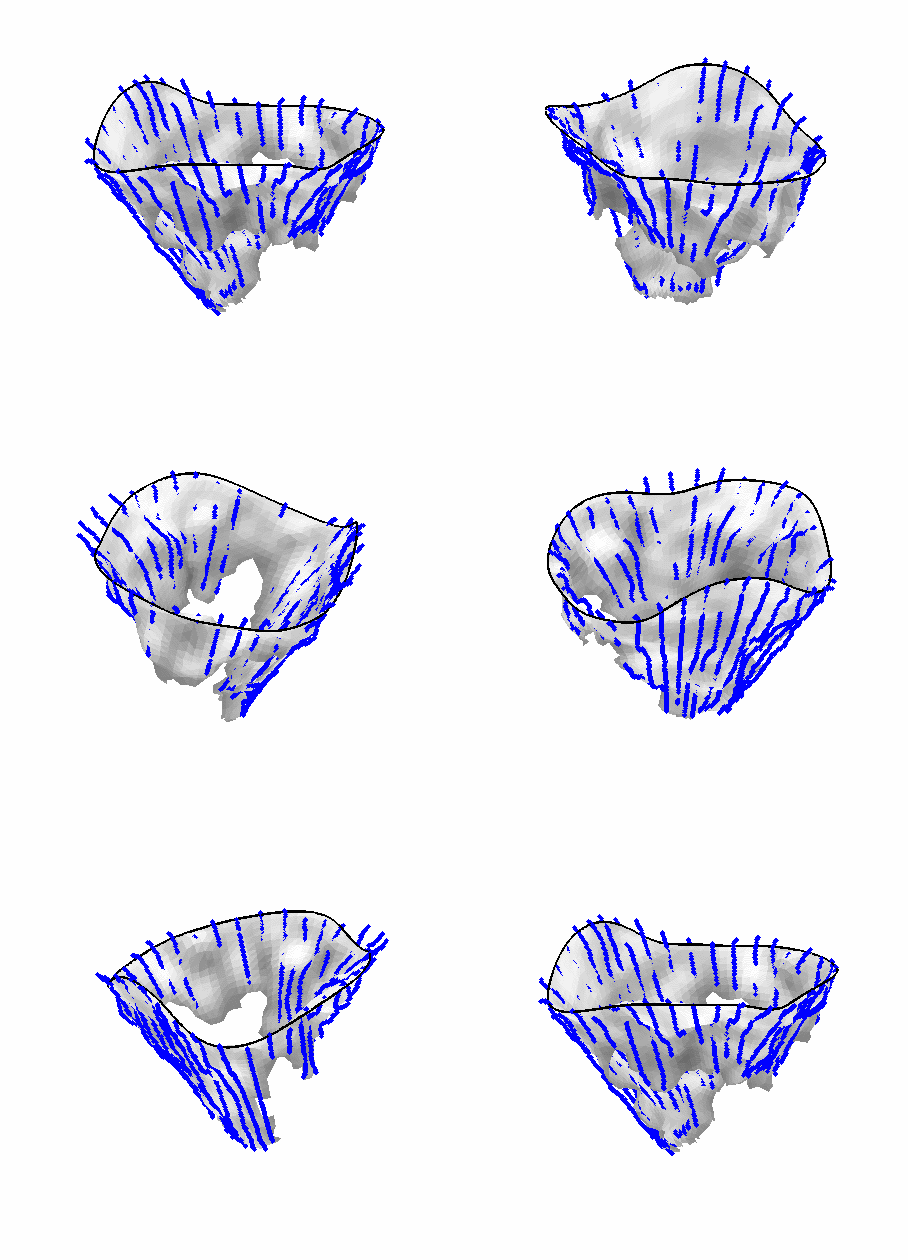 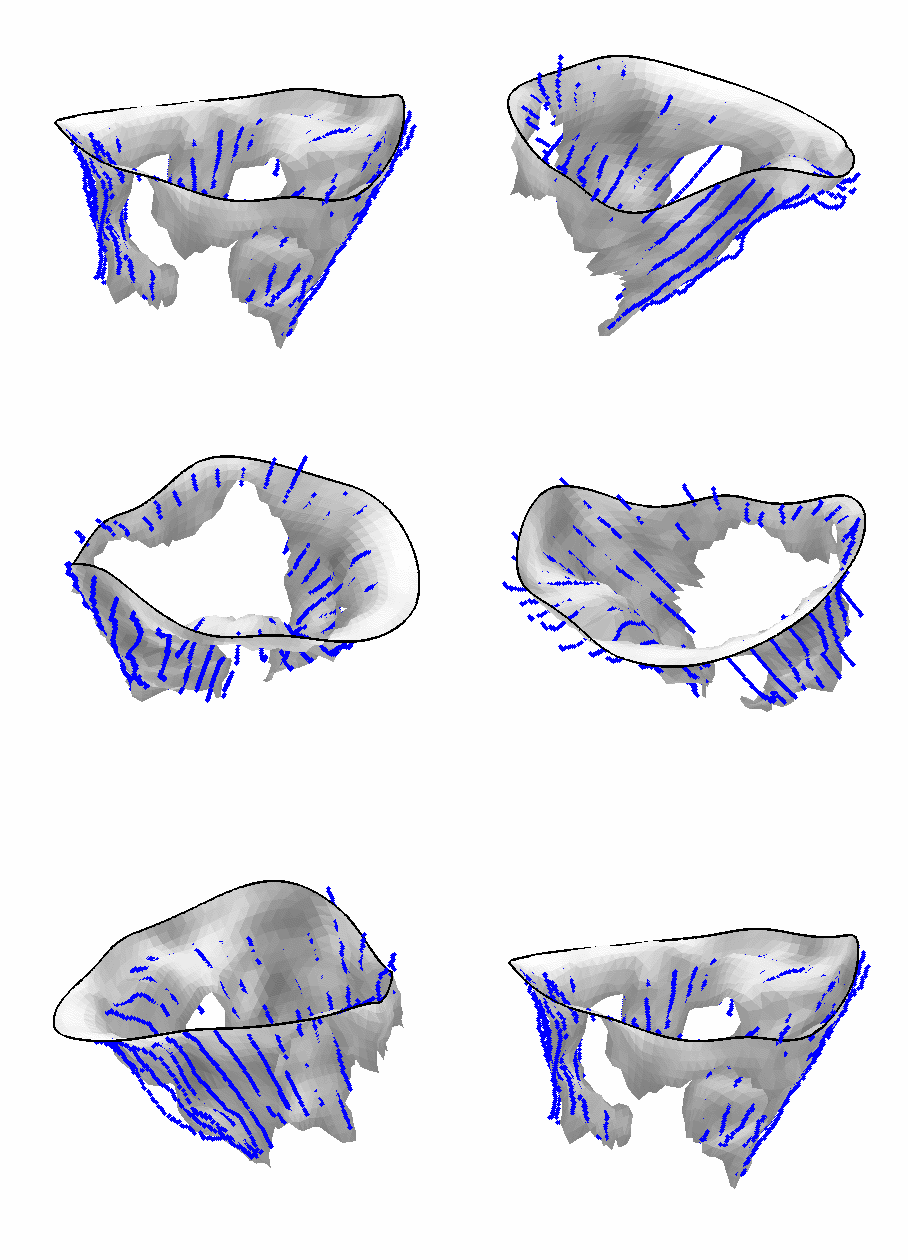
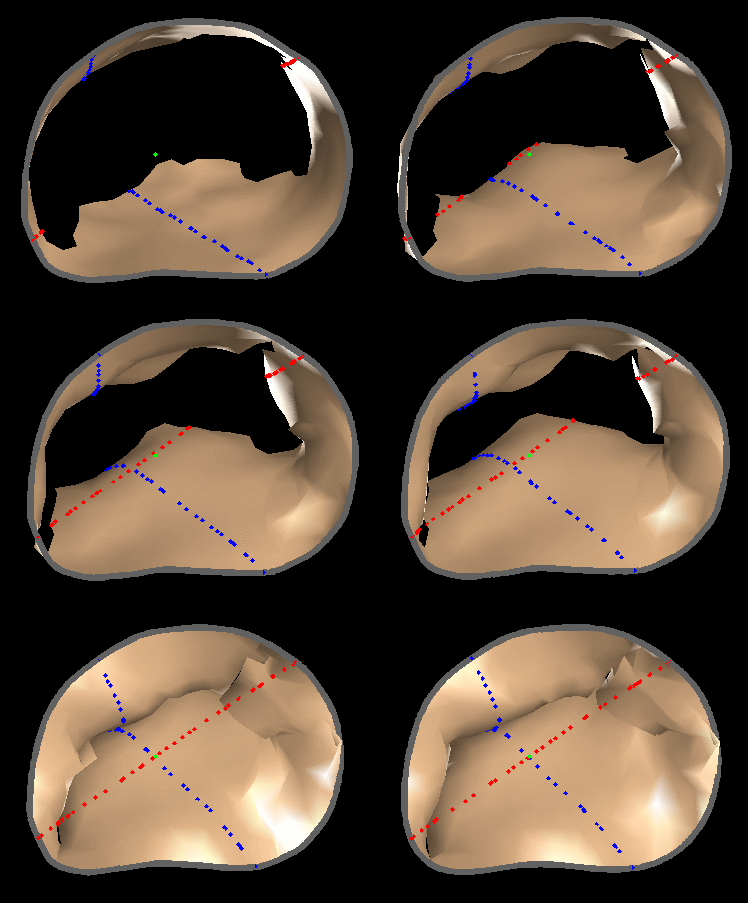
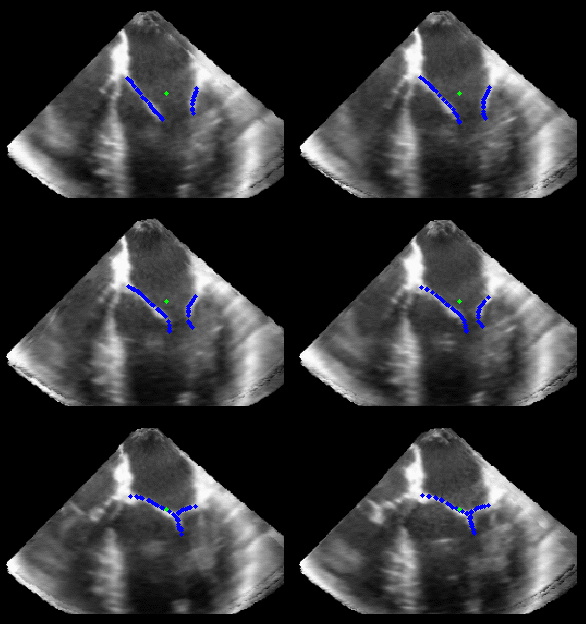
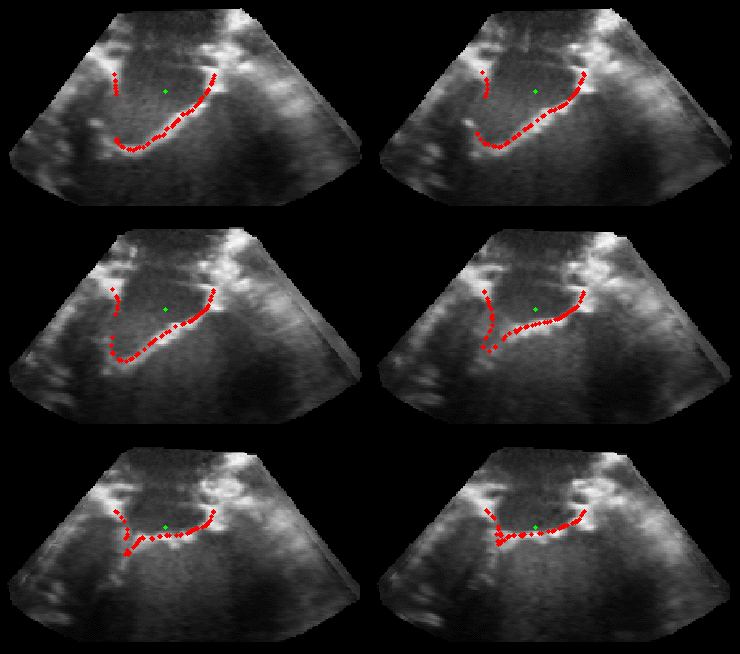
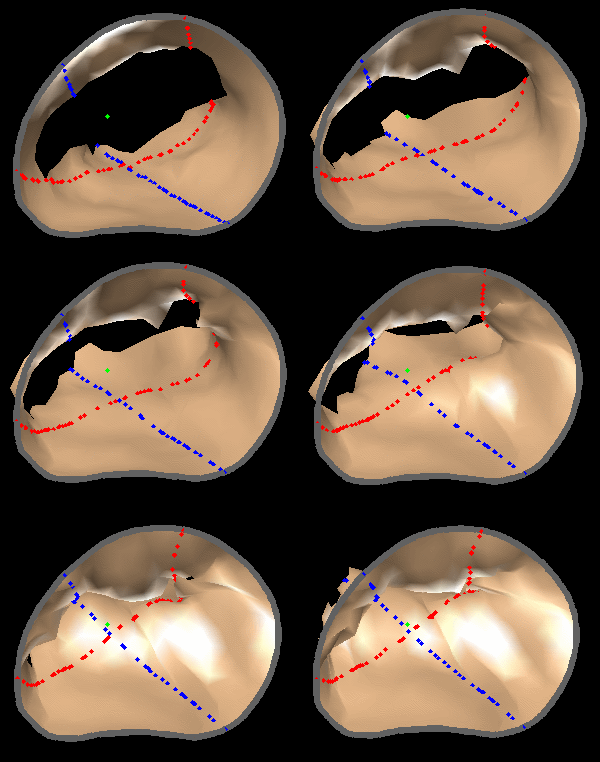
Fig. 4.Comparison of the algorithm-generated leaflet model (shaded surfaces) to manual tracings (contours) made in cut planes about the valve axis for four different valves. |

|
|
|
Figure 5.Results of the mitral valve segmentation method during valve closure for (Top Row) a normal mitral valve and (Bottom Row) a stenotic mitral valve. The comparison of the mesh location in the image planes (red and blue points) relative to the leaflets as seen in the images show the effectiveness of the 4D mitral valve segmentation method for ultrasound. |