Towards Realistic Vibrotactile Display in Virtual Environments
Parris Wellman and R. D. Howe
ABSTRACT
This paper investigates the use of vibrotactile feedback to add a further dimension of reality to virtual environments. We describe a system which incorporates low frequency force feedback and an inexpensive vibrotactile display system composed of modified audio speakers, a PC sound card and a 2 channel current amplifier. We examine the initial problem of stiffness perception based on this vibrotactile feedback. To determine the appropriate waveforms to use in virtual environments we examine the waveforms that are produced when subjects tap on surfaces of varying stiffness with an aluminum stylus. A simple exponentially damped sinusoidal model is presented for these vibrations. This model is then used to produce waveforms for an experiment that assessed the validity of this characterization and the effectiveness of vibrotactile stimulation in conveying stiffness information in a virtual environment. The results are compared with a similar experiment in which subjects tapped directly on different real surfaces using a stylus. Using these simple waveforms for vibrotactile display in our test system gives a relatively accurate description of the phenomenon and allows subjects to accurately distinguish surface stiffness.
VIBRATION CHARACTERIZATION
We consider tapping on a surface with a metal stylus, a task which humans are adept at using to distinguish the stiffness of surfaces. Vibration waveforms produced by contact with a grasped object vary with many factors, including material stiffness, shape of stylus and object, inherent material damping, contact velocity, grasp stiffness and finger properties to name a few. We want to find simple analytic functions that capture the essential information from these vibrations. For the purpose of the present study, we restrict ourselves to five different samples of the same shape and just examine the difference in stiffness. We determined their stiffness using a force sensor with a 10 mm diameter spherical tip and a micrometer driven linear stage. In Table 1, one can see that their stiffness ranged from 4500 N/m (collapsed polystyrene foam) to greater than 160,000 N/m (aluminum) with this particular probe shape.
| Sample | Material | Stiffness (N/m) | Peak Amplitude (@ 0.2 m.sec) | Attack (Hertz) |
| 1 | Collapsed Polystyrene | 4,500 | 0.033 | 43 |
| 2 | RTV Silicone | 5,800 | 0.034 | 50 |
| 3 | Basswood | 19,000 | 0.113 | 100 |
| 4 | Plastic | 140,000 | 0.472 | 1000 |
| 5 | Aluminum | >160,000 | 1.000 | 4000 |
We used only one stylus for all trials. With these restrictions there are two variables that must be considered. First, what difference in waveforms distinguishes one surface from another? Answering this question will allow us to determine the proper shape of the waveforms to be replayed. And second, what is the difference in the waveforms produced when a person taps on the surface with differing velocity? Finding the answer to this second question will allow us to appropriately scale the vibrations with differing impact speeds.
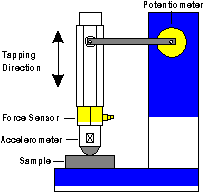
In order to answer these questions it is necessary to obtain data relating contact vibrations with different surface stiffness and impact velocities. For this purpose we used an aluminum stylus fitted with a spherical steel tip 10 mm in diameter. This stylus was instrumented with an accelerometer in the tip, a force sensor mounted coaxially with the tip and a tracking lever arm mounted on a potentiometer to record its position during a tapping operation. We obtained an estimate of the velocity at the instant of impact through backward difference. Figure 1 shows a schematic view of the stylus.

Figure 1 - The Vibration Measuring Stylus.
Vibrations are sensed using a Kistler type 8616A500 Piezotron accelerometer, which has sensitivity from 5 Hz to its resonant frequency of 125 kHz. Using this instrumented aluminum stylus grasped in the fingers we tap on each of five different surfaces at four different velocities and record the position of the probe and the vibration signals produced. All of the samples were 50 mm x 50 mm square with a thickness of 10 mm. A 12 bit National Instruments D/A board and DADISP data acquisition software sampled the vibration and position signals at 40 kHz while running on a 486-33 MHz IBM-PC compatible. Figure 2 shows typical waveforms recorded for a tap on plastic at 0.289 m/s (left), and at 0.205 m/s (right).
After examining the signals for the range of speeds and materials we found that the following generalizations apply, at least for the samples and stylus we used:
- The attack phase of the waveform (the time from start of the initial large peak in the wave to the time that it first passes again through zero) is nearly uniform for a given material, and for aluminum is approximately 0.25 milliseconds (for an initial frequency of about 4000 Hz). The duration of this attack decreases as material stiffness increases. Table 1 summarizes the frequency of the attack for the five samples while Figure 3 portrays the variation in attack with material stiffness.
- The initial amplitude peak scales nearly linearly with velocity. Figure 4 shows the variation in amplitude of the vibrations for RTV silicone across the four velocities tested, as well as a best fit line.
Good Vibrations
These observations suggest a simple form for an analytic approximation to the actual waveforms. We can see that the amplitude of the waveforms can be scaled linearly with the velocity of impact in the direction of interest. Thus, the overall amplitude of the wave obeys the scaling law,
where L is the amplitude scaling factor which varies with material stiffness, as found in Table 1, D is a scaling factor that again depends on material stiffness and can be derived from the material relationships and V is the magnitude of the impact velocity.
Lamotte (1994) has conducted some experiments which indicate that stiffness perception in this situation is principally due to the amplitude and frequency of attack of the waveform. Together with the observed shape of the waveforms (see Figure 2), this suggests we model the contact vibrations as an exponentially decaying sinusoid,
where Q(t) is the vibration produced by the contact, A(v) is given in equation (1), B is a decay constant picked to match the apparent decay envelope of the waveform, and W is found from
where f is the frequency of the attack portion of the wave. The graph of variaton in duration of the attack with material stiffness is approximately exponential and thus it appears to be possible to represent a wide range of stiffness based on an exponential approximation to this curve (to find f) and equation (2) to find the vibration waveform.
EXPERIMENTAL APPARATUS
The experiments presented here are designed to test the effectiveness of vibrotactile display in conveying stiffness information in virtual environments. In the first experiment, subjects evaluated stiffness of a real sample by tapping on it with a 100 gram aluminum stylus. This gave us a baseline for human performance with which we can compare the results obtained in the virtual testing. The second experiment measured the ability to distinguish a range of surface stiffness in virtual environments using the analytic waveforms described in the previous section.
The Virtual Environment Testbed
The primary apparatus in these experiments is one-half of a teleoperated hand system that is fully described in Howe (1992). This planar two fingered hand uses a direct drive, parallel linkage design, which minimizes friction, backlash and moving mass. It provides us with a circular workspace of 100 mm diameter and a peak tip force of approximately 3 N.
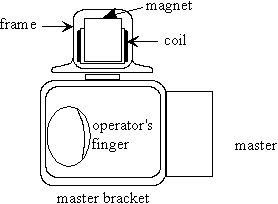
This system provides us with the ability to display contact forces and vibrations generated in the virtual world when the master manipulator is used as a haptic interface. The master manipulator's force bandwidth is approximately 30 Hz, ample for large-scale force information, but lacking the ability to produce the nearly 1 kHz vibrations that humans can perceive (Kontarinis and Howe 1994). To produce this high frequency feedback, we employ two vibrotactile displays, made from speakers with the cones removed, inverted and mounted to the finger tips to provide inertial shaking forces. Figure 2 shows a schematic drawing of one of the fingers with a vibrotactile display attached.

Figure 2 - Side view of one finger and vibrotactile display.
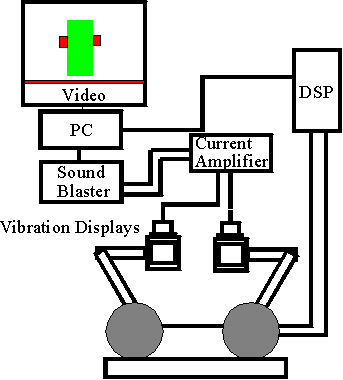
The teleoperated hand is controlled by a Texas Instruments TMS320C30 Digital Signal Processor (DSP) residing in a 486/33 personal computer (PC). The four joint motors are controlled by a servo loop running on the DSP at approximately 2.5 kHz. The virtual world model also runs at this high servo rate on the DSP. The PC is used to display the real time graphics and performs the computations necessary to implement the vibrotactile feedback in the virtual environment. The vibrotactile displays are driven from a Creative Labs SoundBlaster16™ digital sound card that is also resident in the PC, and which is used to control a specially constructed voltage to current amplifier. The vibrotactile display system exhibits nearly flat from voltage input to acceleration output (within 1 dB) frequency response from 40 Hz to 5 kHz and has a peak achievable vibration amplitude of approximately 50 m/s2 at 100 Hz (when attached to our system, with an operator's finger present). Figure 3 shows a system block diagram.

Figure 3 - A block diagram of the virtual reality system.
The PC receives updates on the state of the virtual environment from the DSP through dual port memory that is located on the DSP card. Two-dimensional VGA graphics are used to display the locations of the fingers and objects in the virtual space. While the PC runs at 1 kHz, the graphics are updated at about 30 hertz, which results in nearly flicker-free video, and places a minimal load on the processor. The PC is responsible for synchronizing the image of the virtual world and the high frequency feedback with the forces felt by the user. The PC runs the sound card in the background, and plays back the appropriate waveforms when the operator comes into contact with a virtual surface.
Objects in the virtual world are modeled as massive planar viscoelastic systems. Contacts between objects in the environment are modeled as parallel springs and dampers so the contact force is
where F = (fx fy)T is the force produced in the direction of the spring (N), K is a diagonal 2x2 stiffness (N/m) matrix, C is a diagonal 2x2 viscosity (N/m/s) matrix, r = (x y)T and dr/dt = (dx/dt dy/dt)T are the relative penetration of the finger into the object and the relative velocity of the finger to the object, respectively. Thus the equation of motion for the object is given by
where M is the 2x2 inertia matrix of the object in question. Equation (5) was then numerically integrated to give the velocity and position of the block at every servo cycle. Finally, the force felt by the human operator is just,
The x and y components of this force are fed back to the operator through the teleoperated hand system at each instant in time.
EXPERIMENTAL PROCEDURES
Five male and two female subjects, 21-27 years old, participated in the experiments to assess the effectiveness of the vibrotactile feedback in portraying the stiffness of the five test surfaces. All subjects were allowed to gain sufficient practice with the live tapping and the virtual reality system so that training effects were not significant. The subjects were not allowed visual feedback during the experiments, and were required to wear headphones playing white noise to mask any audible signals.
Live Tapping Experiment
Subjects were asked to tap on each of five different surfaces with a 100 gram stylus and to determine their relative stiffness. Subjects were instructed to tap on the surface rather than press on it slowly, in order to prevent determination of surface stiffness through kinesthetic rather than vibration information. The surfaces were presented in random pairs, and the subjects were asked to determine if the first sample was harder than the second or whether the second sample was harder than the first. They were allowed to switch the samples as often as they wished until they reached a judgment. All subjects were informed that five distinct samples were tested. No time limit was imposed on the subjects. Subjects completed a total of 120 trials.
Virtual Tapping Experiment
The test subjects were asked to tap on a virtual block using the master manipulator alone. Five different waveforms were presented in random pairs and subjects were required to choose between the same options as in the first experiment. Subjects were allowed to switch back and forth between virtual surfaces as many times as they wished. In this experiment the surface stiffness was kept constant at a relatively soft value of approximately 2500 N/m and a viscosity of 100 N/m/s in order to eliminate kinesthetic cues entirely. This was done for two reasons. Our first motivation was that many virtual systems cannot portray high stiffness stably and effectively and we were interested to know whether it was possible to convince people that a surface was harder than the kinesthetics presented through the addition of this vibration information. And second, we wanted to be sure subjects were discriminating based on just the variation in vibration waveforms, not on some combination of waveforms and kinesthetic cues.
The subjects were informed that this was the case and that they would be presented with five distinct waveforms. They were also informed that the same waveform might be played back for both items in a pair. Subjects were also asked to keep their tapping velocity low, as the amplitude of the vibration display is limited, and the saturation of the display at different velocities could give cues to the subjects. This was accomplished through the use of an L.E.D. that was lit when subjects exceeded the maximum allowable velocity of 175 mm/sec. Subjects were allowed to practice with the system before the vibration waveforms were played back in order to become accustomed to this maximum velocity. Subjects had little trouble remaining below this velocity during the testing.
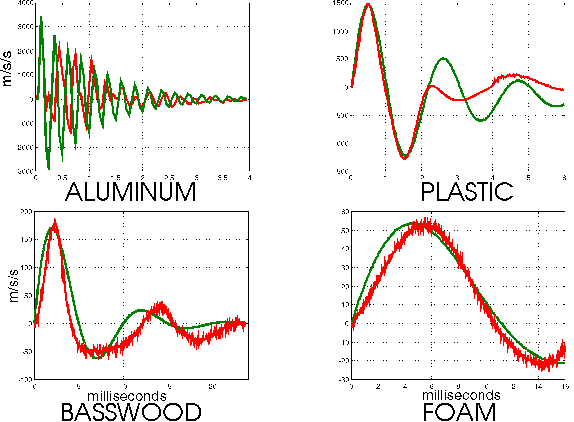
The waveforms used here were the analytic functions constructed based on equation (2) with B held constant at 100, and the frequency of the sinusoidal term taken from Table 1. The amplitude was scaled by equation (1), also with values from Table 1 with values for lambda determined from the slope of the velocity versus acceleration curves. Figure 4 shows representative waveforms for a virtual block for four materials. The red line in the figure represents actual data and the green line is the function that was played back for the subjects. The playback of the waveform is triggered when the virtual stylus first makes contact with the virtual object. Timing of the playback of the waveform appears to be a critical parameter for convincing test subjects of the reality of the surface. For the purposes of this experiment, timing was set to coincide with the beginning of the force pulse that was felt when the subjects tapped on the surface.

Figure 4 - Typical waveforms played during virtual reality testing (green line) and a recorded waveform at 0.289 m/s impact velocity (red line).
RESULTS AND DISCUSSION
Tables 2 and 3 present the data from the experiments conducted to determine the ability of vibrations to convey stiffness information. Only 15 combinations of pairs are presented, the remainder being filled with zeros, because order of presentation had little apparent effect on subject's performance. For example, the table includes the data from trials when material 1 was presented first, followed by material 2 and also from trials when material 2 was presented followed by material 1. Subjects completed a total of 120 trials.
Live Tapping Experiment
| Material | 1 | 2 | 3 | 4 | 5 |
| 1 | 50 | ||||
| 2 | 43 | 51 | |||
| 3 | 75 | 94 | 53 | ||
| 4 | 100 | 100 | 86 | 50 | |
| 5 | 100 | 100 | 75 | 33 | 52 |
Table 2 shows the results of the live tapping task. In general, subjects were quite successful in distinguishing the stiffness of the samples. Materials of widely disparate stiffness (e.g. materials 1 and 4) were most easily differentiated. Subjects reported that they had little difficulty with these cases, and took significantly less time to make these determinations. Distinguishing the softest samples (materials 1 and 2) was difficult for the subjects. This may be because the small difference (approximately 15%) in stiffness of the two materials makes them difficult to distinguish.
The harder samples were also difficult to disambiguate. In particular, materials 4 and 5 (plastic and aluminum) were often confused. This may again be because their stiffness varied by only a small amount (approximately 10%). It may also be that the vibrations produced during contact with the harder material are above the range of perception by human mechanoreceptors (nerve endings), since the aluminum sample produced vibrations well in the audible range, and could easily be distinguished by the subjects when they could hear the tapping.
Virtual Tapping Experiment
Table 3 shows the results of this experiment. In general, subjects were again reasonably successful in distinguishing surface stiffness, although the fraction of correct responses was somewhat lower than in the live tapping experiment. As in the preceding experiment, subjects reported that it was very easy to separate very hard from very soft surfaces, and they took little time to reach a decision. Also as in the live experiments, the subjects had difficulty distinguishing the hardest surfaces.
Again, this inability to distinguish the hardest surfaces may be due to saturation of the human mechanoreceptors. Subjects were able to easily distinguish the surfaces in informal testing when they were allowed to hear the waveforms. One should note that we did not make an attempt to vary object and probe shape nor the haptic interface stiffness and thus we cannot say that these results will hold for all combinations of probe shape and material properties. Subjects also reported that while the surface felt better than the surface unaugmented by vibration information (they consistently described the unaugmented surface as being "flat") it did not necessarily feel "real."
| Material | 1 | 2 | 3 | 4 | 5 |
| 1 | 50 | ||||
| 2 | 80 | 57 | |||
| 3 | 90 | 60 | 50 | ||
| 4 | 86 | 67 | 77 | 55 | |
| 5 | 100 | 100 | 100 | 57 | 50 |
CONCLUSIONS
We have developed an inexpensive system for adding vibrotactile feedback to virtual environments. These experiments have shown that humans are able to determine surface stiffness from their perception of high frequency vibrotactile feedback without variation in force feedback stiffness. Further, we have shown that a simple mathematical characterization of a complex vibration waveform is capable of producing vibration signals that are accurate enough to allow humans to distinguish a variety of surface stiffness.
Further work will be directed at varying the amplitude separately from the frequency of the waveform and ascertaining the relationship between the timing of these vibration signals and the perceived surface stiffness. We are continuing work to make the surfaces feel more realistic. We are also working to develop a simple characterization for wide range of surface textures and manipulation events.
Future work will include an exploration of the interaction between the forces felt in the virtual environment and the vibrations displayed. The virtual environment provides an opportunity to investigate the role of vibrations on task performance, as all other parameters can easily be held constant while the vibration waveforms are varied. Finally, the optimal crossover frequency from force feedback to vibrotactile feedback must be determined to permit design of optimal force and vibration haptic interfaces. Other work includes designing and constructing vibration displays that provide more amplitude.
Acknowledgments
Funding for this work was provided by the office of Naval Research under ONR Grant No. N00014-92-J-1887.
REFERENCES
Colgate, J. Edward and J. Michael Brown. "Factors Affecting the Z-Width of a Haptic Display." Proceedings of the 1994 IEEE Conference on Robotics and Automation. San Diego, CA. May 1994.
Hawkes, G. S. "Apparatus providing tactile feedback to operators of remotely controlled manipulators." (U.S. Patent No. 4,655,673). Filed on May 10, 1983.
Howe, R. D. "A force reflecting teleoperated hand system for the study of tactile sensing in precision manipulation." Proceedings of the 1992 IEEE International Conference on Robotics and Automation. Nice, France, p. 1321-1326. 1992.
Howe, R. D. and M. R. Cutkosky. "Sensing skin acceleration for texture and slip perception." Proceedings of the 1989 IEEE International Conference on Robotics and Automation. Scottsdale, AZ, 145-150.
Kontarinis, D. A. and R. D. Howe. "Tactile Display of High Frequency Vibrations in Teleoperation and Virtual Environments." Presence, in press. 1995.
Lamotte, Robert. "Tactile Discrimination of Softness" (Abstract). Society for Neuroscience Meeting. Miami, FL. Nov. 1994.
Massie, Thomas and J. Kenneth Salisbury. "The PHANToM Haptic Interface: A Device for Probing Virtual Objects." Dynamics and Control 1994. Proceedings of the 1994 ASME Winter Annual Meeting. ed. Clark J. Radcliffe. Chicago, Il. 1994.
Minsky, Margaret and Ming Ouh-young, Oliver Steele, et als. "Feeling and Seeing: Issues in Force Display." Computer Graphics. vol. 24 no 2. ACM. 1990.
Minsky, Margaret. "Computational Haptics: The Sandpaper System for Synthesizing Texture for a Force-Feedback Display." Ph.D. Dissertation. MIT. 1995